Join us at The Whalies • April 10th
Get Your Ticket
Check our DTC Holiday Gift Guide 🎁
Read Now


When it comes to running a DTC brand, there's no shortage of data at your disposal. Learn Nate's best tips & tricks for gathering your data, setting meaningful goals, and surfing the wave of data with ease.
Modern DTC emerged from the shadows of catalog brands more than a decade ago. The stated purpose of this movement was to become the gold standard for brand building and to challenge the legacy approach of wholesale distribution and owned retail.
The underpinning of the DTC assault was that brands built on the internet would be able to create a direct (1:1) relationship with their consumer (hence, Direct to Consumer) and cut out the middle man or woman.
The thesis goes like this:
This all sounds AWESOME. No brainer. Go interwebs!
In the early 1990's, the term ‘Big Data’ splashed onto the digital scene with the advent of personal computing and Moore’s Law. Effectively, Big Data refers to the exponential proliferation of data as well as the necessary ability to process, store, and analyze that data.
The concern around big data made it a buzzword for executives at legacy brands. The big question on their minds: how are we going to keep up with all of this data? They invested heavily in information technology, data infrastructure, servers, networks, and so on as a means to stay on top of the increased data load.
Today, DTC Brands look back at the data load that legacy brands were facing and smirk. In relative terms, data captured throughout a brand’s ecosystem in the 1990's through 2010's was….well…basic.
Today we collect mountains of First Party (directly collected and hosted data) and Third Party (collected through 3rd Party platforms) Data. Every ad view, every site visit, every click, every order, every shipment, every customer service interaction, (and more) gathers data.
The ripples of data that began to form in the bygone era have become tidal waves chasing down would-be DTC surfers.
But wait: wasn't this wave of data was actually supposed to be the superpower of DTC as described above?
To be clear — this absolutely can still be the case, but more often I have observed it to be an Achilles Heel for DTC brands. Let’s dive in on how we flip the script back in DTC's favor.
Far and away, the most common data problem for DTC Brands is a shaky or poorly constructed foundation. In DTC Needs a New Operating System, describe the atomic elements of DTC Data:
The relationships between these atomic elements must be very clearly defined, and there must be a ‘primary key’ that links them.
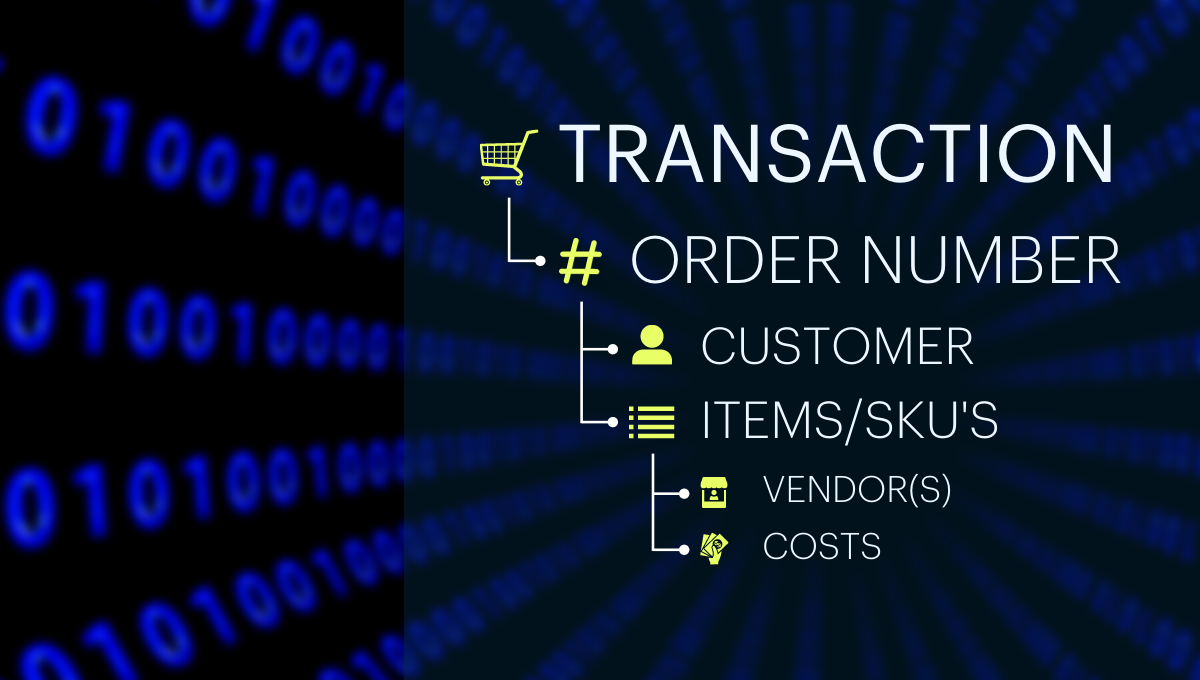
For example, the primary key for a transaction is most often an order number. This order number is associated with a customer. Within the order, there are items that were transacted (most often linked as SKU). These SKUs and inventory were often created by a vendor and have associated costs to make and store the product as well as fulfilling the product.
This is an illustrative example of a broader set of important points, most notably that the relationships between elements of your data must be structured appropriately and in a way that can frictionlessly scale up over time and with added complexity. This is the foundation laid that will support a large house — or a skyscraper — of a brand.
This was a practice that legacy brands really understood and honored. Modern DTC has taken shape through the advent of lower barriers to entry. Platforms like Shopify have made it very easy to enter the fray of eCommerce, but lack the sophistication and direction to ensure that brands create the proper data structures to scale beyond their infancy.
Creating a strong foundation of data structures, hierarchies, and attributes is the most important step in leveraging data well. Additionally, the sooner a brand puts effort and resources behind building the right data structure, the better. The further into a brand's lifecycle, and the greater the scale of its operation, the more challenging and costly it becomes to unwind mistakes or oversights of the past.
The second biggest mistake I have observed DTC Brands make with respect to data is to orient their data practices and services by function.
Marketing gathers perhaps the most robust data in the modern DTC data ecosystem. As a result, data infrastructure, reporting, and resources have been created to serve the marketing function as though it is the entire house, not just a large important room within the house.
DTC brands will often ‘nest’ business intelligence or analytics under marketing. The result — as you might expect — is that marketing data exists to answer marketing questions and dictate marketing actions. On its own, this isn’t much of a problem for marketers, but through a broader lens ,this is a big problem for the balance of the organization. The data and intelligence become siloed within the marketing team, and the balance of the organization is underserved. Worse, the connective tissue and broader actions that a business can learn from and act on begin to dissolve. Worse still, the data is oriented to tell a story that benefits marketing.
In this very common example, objectivity is lost.
How do we prevent this from happening? By ensuring that data and business intelligence is organized at the enterprise level.
To me, this means that data lives across the organization. The stewards of systems and data are not nested under a specific function other than their own. They are independent and objective.
Their job is to understand:
Objective, structured, and standardized data is absolutely critical, because the goal of harnessing data is to build an objective narrative. The narrative must be rooted in truth and free of bias (to the extent possible). These narratives are constructed from the data, shared amongst key partners across the business and the narrative is ultimately adopted via enrollment by all truth seekers. Once this happens, reasonable assumptions can be formed that lead to grounded actions. These actions have results that can be measured. With this in mind, we’re moving the ball forward together.
DTC and KPI Acronyms love each other as Allie and Noah did in The Notebook. A kind of timeless, durable, everlasting love rarely observed, but always cherished.
However, this love and the proliferation of ecommerce KPIs have only made our jobs more complicated and clouded our vision. Just because something can be measured and improved does not make it important.

So how do we decide what’s important and what ‘moves the needle’? (Yes, this is a cliche, but give me a better articulation….I’ll wait).
There are many different frameworks for deciding which KPI to measure, but I’m a fan of OKRs.
The basic approach of OKR setting is to establish very high-level goals for the business and a unique strategy to accomplish those goals. From there, a set of Objectives are defined that typically span the organization. Those objectives are paired with Key Results (outcomes). These Key Results have measurables against them.
Fight the urge to have too many Objectives and Key Results. Focus on the highest leverage opportunities and keep the Key Results well-defined, time-bound, and easily measured.
This approach to Goal setting will help define a set of KPIs that really matter as you set out to grow the top and bottom lines of your business. This practice should also ensure that the critical KPI in your business span a number of different functions and hit on the contextual relationships.
When ‘Marketing’ KPIs move, there should be a relative reaction in another KPI (for example, inventory velocity). This movement dictates actions on both sides of the Supply/Demand equation. Marketing moves to double and triple down on what’s working, and the Operations side of the business moves quickly to increase inventory availability for the product most commonly at the center of the transactions. Frictionless scale is on the horizon!
Now that we have our KPI and understand the relationships, dependencies, and connective tissue, we’re ready to assemble a single view or set of views that allow us to interpret the data we are collecting in real time and over longer time horizons.
Again, the goal here is to democratize dashboards. To allow users throughout the organization to understand what’s happening such that they will be enrolled in the broader objective narrative in the business and that their actions will align with the outcomes that are sought by the organization's goals.
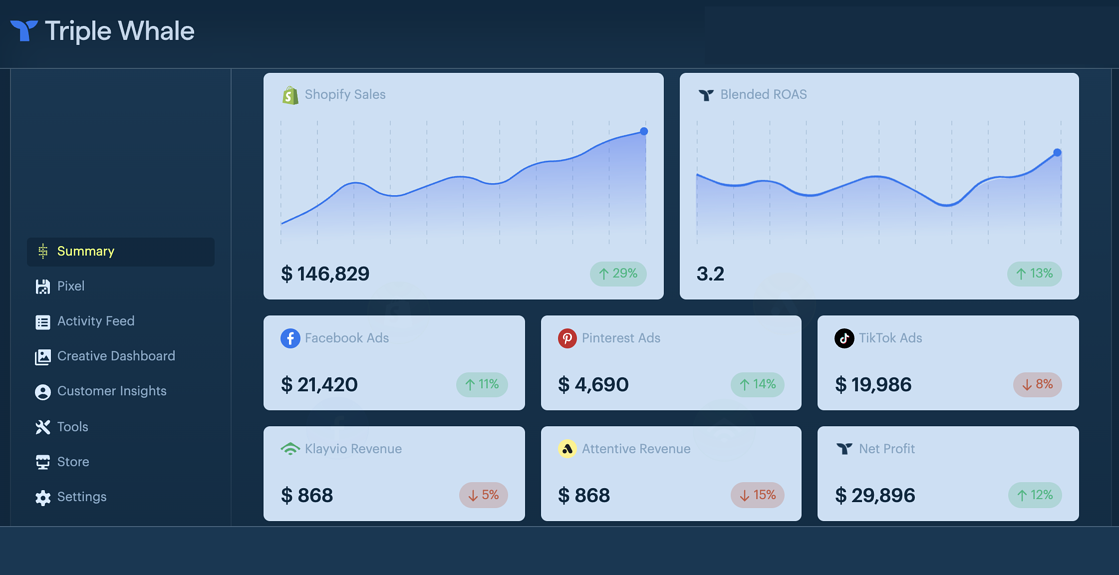
Fortunately, this is where the most innovation has happened. APIs have allowed SaaS solutions to connect a wide range of ‘downstream’ data sources and bring together data in a centralized and harmonized view. Heavyweight BI solutions exist for brands wishing to build their own data warehouse and the Analytics/Dashboards on top of that. Lighter-weight solutions exist and are rapidly improving to meet the needs of functional areas of the business beyond Marketing (Triple Whale is a great example).
In summary, take the following steps to surf on your data, rather than being crushed under the tidal wave:
And with that, surfs up!
Click here to book a demo today, so you can start building the data dashboard of your dreams.

.png)
© Triple Whale Inc.
266 N 5th Street, Columbus OH 43209


